This article is a part of the February issue of the Quant Value newsletter where I gave readers an idea of how to position their investments in 2018.
You know I do not make forecasts.
In spite of it being a complete waste of time to even look at them, as numerous research studies have proved, for some reason humans are drawn to them like a moth to a flame (me too but I have learned to ignore them as far as possible).
What I would like to do instead is show you a few charts that tell you where we are at the moment.
The market is a runaway train
In general index funds are a great idea. They give investors, especially small investors, the chance to invest in a diversified index at a very low cost.
And they have done great, outperforming a lot of investors and fund managers that make their own investment decision.
You can clearly see with in the newsletter where in North America its performance is way behind the S&P 500 index because it was holding a LOT of cash. But as with all good ideas, if you overdo it the results are hardly ever good and that is what I fear is happening in markets throughout the world – but especially in the US stock market.
Price insensitive buyers
Because so much money continues to be invested in index funds they have basically become the market – especially in the USA.
As you know, if there are more buyers than sellers prices go up and that has happened in the USA for nearly eight years after the market bottomed out after the financial crisis in March 2009.
The fact that markets have not gone down (not even 5%) for nearly eight years before it started dropping the last few days, and the fact that interest rates are kept near 0% or even negative by central banks worldwide, have led to more and more money flowing into index funds.
This big amount of money has been pushing stock markets to all-time highs.
And this is still going on.
$78.6bn in January this year
According to Bloomberg investors poured $78.6 billion into US exchange traded index funds in January this year.
That is just over $3.5 billion per business day!
The problem in valuation
There is just one problem with this one-way street of share price increases – profits have not kept up. This means company valuations – the most important indicator of future returns – have gone through the roof as you can see in the following charts.
Sales cannot be manipulated
Let’s first look at the US market valuation in terms of sales.
Sales are a good measure to use because it cannot be manipulated like profits.
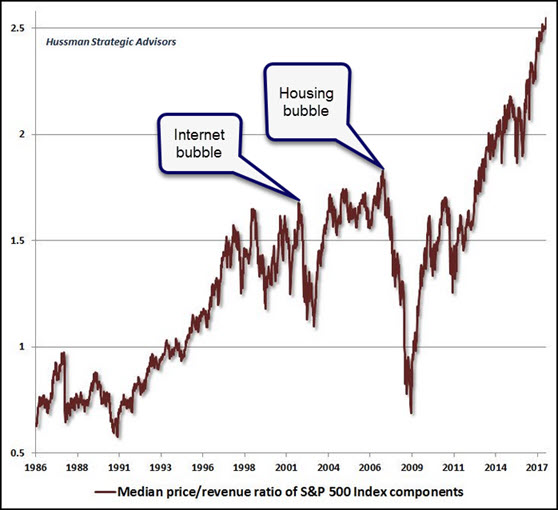
Source: Hussman Funds (I added the comments)
I am sure you will agree – this looks expensive.
Here is another valuation chart
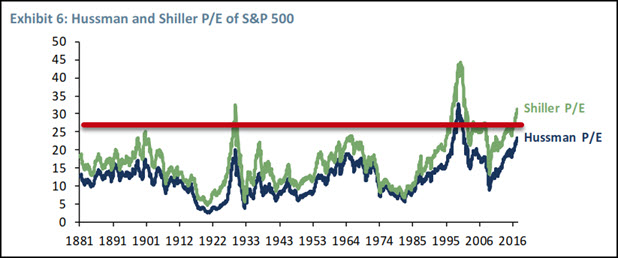
Source: GMO 3Q 2017 quarterly letter (I added the red line)
The chart shows two Price to Earnings (P/E) valuation numbers for the US S&P 500 index.
Compared to the Shiller P/E (green line), which uses past 10 year average earnings, is biased high because earnings tend to grow over time and a 10-year past average earnings number is lower than last year’s earnings.
The Hussman P/E (dark blue line) on the other hand is biased low, since it is always comparing the market to the highest earnings figure we’ve ever seen.
The red line I added to the chart shows the middle value of the current valuation – a valuation of about 27 times earnings.
A 48% fall to get back to the median valuation
These differences do not matter because, compared to their long-term medians (averages) - both are telling the same story – the S&P 500 is trading at about a 93% premium to the long-run median. If it was to fall to its median value it would require that the market falls 48%.
What about my future returns?
So what does this mean for me and my future investment returns you may be thinking?
Well, it does not look good as the chart on the next page clearly shows.
As you can see for all equities – large and small – US or international – for the next 7-years it looks quite sick to say the least.
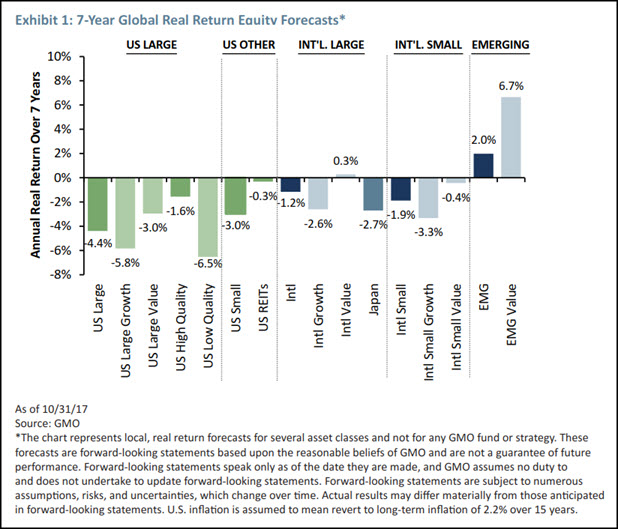
Source: GMO 3Q 2017 quarterly letter
Emerging markets the only hope
As you can see the only market which does offer any hope is emerging markets (EMG) – especially undervalued emerging markets (EMG Value) which looks quite good at 6.7% per year real (after inflation) for the next 7-years.
I do not recommend emerging market companies in the newsletter, but the companies I am recommending are even more undervalued than a lot of “value” companies in emerging market funds I looked at.
This is what the newsletter does for you
Where we are today:
- Late in a long bull market
- Markets expensive nearly everywhere you look
- Not a good time to take a lot of risk for a small return and a
- Large loss if markets falls
Low interest rates is not an excuse
I do not – and I am sure you also don’t - buy the argument that because interest rates are low there is no alternative to equities.
A time to love cash – the hated asset
Cash is a hated asset at the moment and that is why I love it. Inflation is low so you do not lose a lot of buying power if you hold it.
Cash is your best bet because:
- You do not have to nervously look at the market all the time because you are not trying to dance close to the exit like a lot of idiots, thinking that they can get out in time if markets turn down
- You have time on your side to buy bargains when markets have corrected
Newsletter positioned to reflect this
The newsletter is well positioned so you can benefit from the current situation.
All portfolios have a lot of cash
North America: 90%
Europe: 90%
Asia: 31%
The newsletter is only really invested in very undervalued Japanese small companies completely avoided by ETF's funds, Central Banks and most other investors.
What about the rest of 2018
Because we are already positioned very conservatively for the rest of 2018 we will simply keep following the newsletter’s investment model which says:
- Stop buying if the markets are falling
- Only recommend a company when we find value
- Sell if the trailing stop loss is triggered
- Hold high cash levels to buy bargains when markets have collapsed
PS You can sign up for the Quant Value newsletter here
PPS It is so easy to put things off, why not sign up right now?