You may have heard about the Piotroski F-Score but do you believe it can improve your investment returns? If not keep reading, you will be surprised.
When we first heard about the F-Score we were skeptical – after all, it was developed in 2000 by a unknown accounting professor.
Astounding results - Price to book with the Piotroski F-Score
Prof Joseph Piotroski, at the University of Chicago, developed the F-Score to improve the returns of a cheap price to book investment strategy.
And it worked.
If you invested in only those companies that scored best or highest (8 or 9) on his nine-point scale, or F-Score as he called it, over the 20 year period from 1976 to 1996, you would have outperformed the market by an average of 13.4% per year - and this over 20 years!
That sounds just about too good to be true. But it is!
Summary of the back test
Here are two tables from Professor Piotroski’s research paper Value Investing: The Use of Historical Financial Statement Information to Separate Winners:
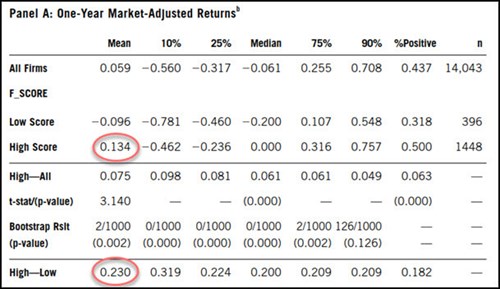
Source: Value Investing: The Use of Historical Financial Statement Information to Separate Winners from Losers p16
High Score = Low price to book companies with a Piotroski F-Score of 8 or 9
Low Score = Low price to book companies with a Piotroski F-Score of 0 or 1
High-Low = Long investment in F-Score High Score companies and short Low F-Score companies
Worked best on small companies
These were the back tested F-Score returns when he split the results between small, medium and large companies.
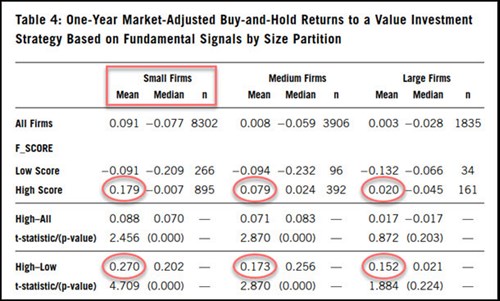
Source: Value Investing: The Use of Historical Financial Statement Information to Separate Winners from Losers p19
As you can see small companies would have given you the best returns. But, because of their size they would most likely not work for a long short strategy so only look at the High Score returns, which was also excellent!
Important! - Companies to avoid like the plague
Avoiding low F-Score companies (0 and 1) is a great idea as you can see for all three groups of companies these companies performed a LOT worse than the market - between -9.1% to -13.2% per year for 20 years!
To start finding high F-Score ideas for your portfolio NOW! - Click here
Does the F-Score also work in Europe?
After getting excited about the returns we wanted to know if the Piotroski F-Score also works in Europe (Prof Piotroski only tested it in the USA) - and in the current market environment.
But there was a problem.
The Piotroski F-Score is not difficult to calculate but you need a lot of accounting information to calculate the nine ratios.
And in order to test it you need this information for a LOT of companies.
We built the F-Score database
We thus build a high quality database of over 22,000 companies in all the developed markets worldwide which allows us to calculate the Piotroski F-Score for all of them at the push of a button.
And this is how the Quant Investing stock screener got started.
110 ratios and indicators at your finger tips
Today the screener can calculate a lot more than just the Piotroski F-Score. At the moment it can calculate 110 other ratios and indicators – a number that grows all the time as we do more research and test more market beating investment strategies.
I'm interested in high F-Score ideas, sign me up!
Getting back to the testing the Piotroski F-Score
The back test
In the research paper “What Works on European Markets: The Best Performing Investment Strategies” (which you get for free when you sign up), we tested 168 different investment strategies, on companies in the Eurozone, to find what strategies would have given you the best return over the 12-year period from 13 June 1999 to 13 June 2011.
In spite of the test period being quite short it was not a good time to be invested in the stock market, as it included the internet stock market bubble (1999), two recessions (2001, 2008-2009) and two bear markets (2001-2003, 2007-2009).
One remarkable finding
In spite of the Piotroski F-Score being a quality indicator (it can’t tell you if a company is undervalued) if you used it as a strategy to select investment ideas you would have done surprisingly well as the Piotroski F-Score was the fifth best single ratio investment strategy we tested.
The following table shows you what returns you could have earned if you used only the Piotroski F-Score to get investment ideas.
Returns using only the Piotroski F-Score
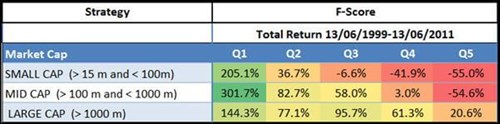
Source: What Works on European Markets: The Best Performing Investment Strategies
The Q1 column shows companies with the best (high) Piotroski F-Score and Q5 companies with the worst (lowest) F-Score.
This means: If you invested only in companies with the highest Piotroski F-Score, your return would have been between 144.3% to 301.7%! An outstanding return I am sure you will agree.
Market returned only 30.5%
For all company sizes the companies with the best F Score substantially beat the market which over the 12-year period of the study returned 30.54 % or 2.25% per year, dividends included.
Piotroski F-Score with other ratios improved returns over 200%
We also tested the Piotroski F-Score with 13 other ratios and indicators to see if it could increase returns.
What we found was remarkable!
For every strategy we tested, if you added the F-Score to any other ratio it would have given you a lot higher returns.
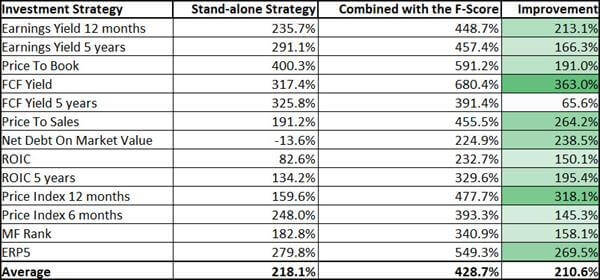
The following table shows you how much the return of the stand-alone strategies were improved by selecting only companies with a good Piotroski F-Score (value of 8 or 9).
Returns increased substantially with the Piotroski F-Score
Source: What Works on European Markets: The Best Performing Investment Strategies
Values colour coded
The values in the Improvement column is colour coded with the highest values green (darker is higher).
Best strategy with Piotroski F-Score = Free cash flow yield (FCF Yield) +680.4%
The strategy combined with the best Piotroski F-Score companies that would have given you the best returns over the 12 year period was FCF Yield which returned just over 680%.
Not bad I am sure you will agree.
Most improved strategy = Free Cash Flow Yield +363%
The Piotroski F-Score was able to add 363% to the return of a strategy of buying only the companies with the highest FCF Yield.
The second most improved strategy was Price Index 12 months (share price today/share price 12 months ago) which the Piotroski F-Score improved 318.1% from 159.6% to 477.7%.
As you can see the F-Score was able to increase the returns of all 13 strategies by an average of 210.6% over 12 years - that’s a huge improvement.
I want the F-Score to increase my returns, sign me up!
Adding quality can substantially increase your returns
Thus adding a quality indicator, which the Piotroski F-Score really is, to your investment strategy or screen can increase your returns substantially.
The Piotroski F-Score, if you look at the way that the nine ratios it consists of are calculated, helps you add companies with good fundamental momentum to your portfolio.
And that's where its real value lies.
How to add the Piotroski F-Score to your investment strategy
In the Quant Investing stock screener it's really easy to add the F-Score to the strategies you use to find investment ideas.
Add it with the slider
You can easily add the F-Score by using one of the four sliders as the following screenshot shows.
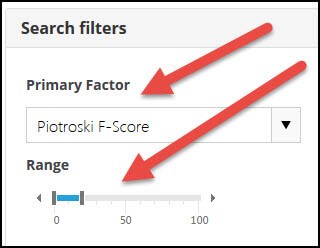
Select Piotroski F-Score from the Primary Factor drop down list under the Quality heading.
To select companies with the best (highest) F-Score move the slider so that you select 0% to 20% or 30% of the Piotroski F-Score values.
Or use filter
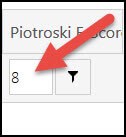
Or you can select the best Piotroski F-Score companies by using the filter function in one of the columns.
To do this first type the number 8 in the field next to the small funnel.
Then click on the small funnel image and select Greater Than.
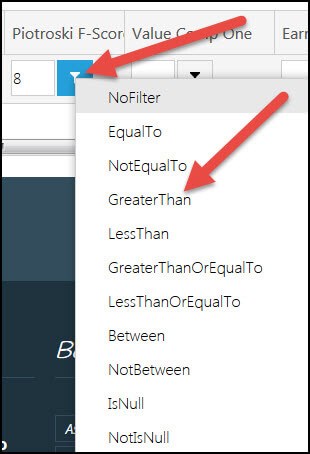
It’s as easy as that to add the Piotroski F-Score to the way you search for investment ideas.
Screener really easy to use
Also the screener is really easy to set up and use.
You can save as many searches as you like which mean you can run them as often as you like with a few mouse clicks.
Everything you have saved is automatically completed for you.
I want better investment ideas, sign me up!
Summary and conclusion - The Piotroski F-Score is a great investment strategy!
You clearly saw that by choosing only high (good) Piotroski F-Score companies from the 13 investment strategies we tested increased returns by an average of over 210% over a 12 year period.
Just think what adding the F-Score to your investment strategy can do for your returns.
All this costs less than a lunch for two
How much can a tool like this cost, you may be thinking?
To make it affordable, and give you a great return on your investment, even if your portfolio is still small we have made the price of the screener surprisingly low.
It costs less than an inexpensive lunch for two each month (Click here for more information).
PS: Why not sign up now, while this is fresh in your mind?