Qi Value Investment Strategy
When we first tested the Qi Value investment strategy (and I started using it in my own portfolio) I honestly did not think it would work this well.
22 year return +1223%
Over the nearly 22 years from May 2001 to December 2022 across markets worldwide it returned an astounding 1223.0%! This is more than 8.3 times the 148.1% the market (MSCI World Index) returned over the same period.
Before I tell you exactly how to implement this strategy in your portfolio first some background information.
We like composite ratios
We are big fans of combining a different ratios to find undervalued companies. This helps you to find companies that are undervalued from different points of view, for example based on earnings and cash flow.
The first such indicator I wrote to you about was the Value Composite One (included in the stock screener) developed by James O'Shaughnessy.
But it has a problem
The problem with the Value Composite One indicator is that it includes the Price to Book ratio.
We have nothing against you using the price to book ratio to find undervalued companies (it works best after a crash), the problem is it underperforms the market for long periods.
You can read more about the underperformance here: Be careful of this time tested value ratio.
To solve the problem
To solve this problem we developed a composite value indicator, which we called Qi Value.
Not only does it exclude the Price to Book ratio, it also includes all the best valuation ratios we have tested up till now, including the work from the research paper Quantitative Value Investing in Europe: What Works for Achieving Alpha.
Qi Value ranks the whole universe of companies (around 22,000) in the stock screener using four valuation ratios. It lets you find the most undervalued companies from different points of view.
How is Qi Value calculated?
Q.i. Value is calculated with the following ratios:
EBITDA Yield
Calculated as: Earnings before interest, taxes, depreciation and amortisation (EBITDA) / Enterprise Value
Earnings Yield
Equals Operating Income or earnings before interest and taxes (EBIT) / Enterprise Value (Read more about earnings yield here: A simple ratio beats the world’s best value funds)
FCF Yield
FCF (Free cash flow) Yield is calculated as Free Cash Flow / Enterprise Value – here free cash flow is equal to cash from operations minus capital expenditure
Liquidity (Q.i.)
Liquidity (Q.i) is calculated as Adjusted Profits / Yearly trading value.
It thus gives you an indication of how high a company’s yearly traded value per share is compared to its profits. A high value means low traded value compared to profits and thus a larger chance of the company’s shares being miss-priced.
In the following article can read about our back test of Qi Liquidity: This overlooked ratio, large funds and hedge funds can’t use, gives you higher returns
Results of the back test
In the first half of 2015 we tested Qi Value against six other investment strategies as well as the market over the 14 year period from April 2001 to February 2015.
The following table summarises the results:
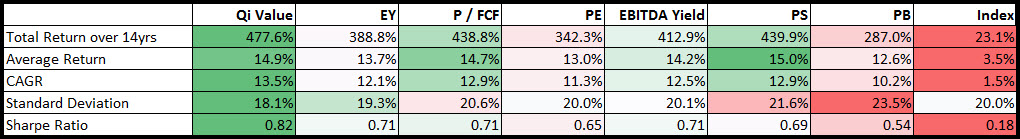
Click table to enlarge
Source: www.quant-investing.com
CAGR (Compound Annual Growth Rate)
Index = MSCI World Index
We tested the Qi Value indicator against:
- Earnings Yield (EY) = Earnings Before Earnings and Taxes (EBIT) / Enterprise Value
- Price to Free Cash Flow (P/FCF)
- Price to Earnings (PE)
- Earnings before interest, taxes, depreciation and amortisation (EBITDA) / Enterprise value
- Price to Sales (PS)
- Price to Book (BP)
To start using Qi Value in your portfolio now - Click here
Qi Value is a lot better
As you can see Qi Value performed better than all ratios, only the average return of the Price to Sales ratio was higher.
Apart from that the Qi Value had a:
- The highest total return +477.6%
- The highest compound annual growth rate over the 14 year period
- The lowest standard deviation which means Qi Value returns were not as volatile as the other ratios
- The highest Sharpe ratio (higher is better) which means it would have given you higher risk adjusted returns. Here is the Sharpe ratio definition.
What about 2016 to 2022?
We have continued tracking the results of the Qi Value to make sure the back test remains valid.
Here are the updated results:
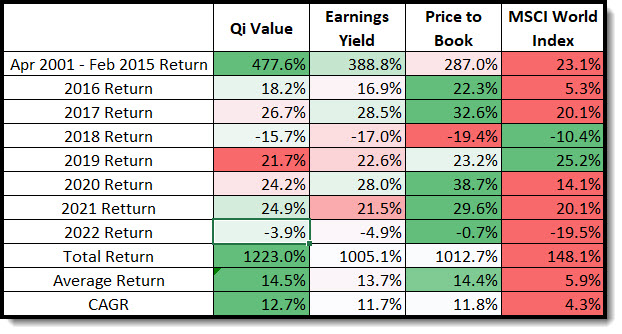
Click table to enlarge
Colours show horizontal returns (Dark Green = Highest, Dark Red = Lowest)
Source: www.quant-investing.com
CAGR (Compound Annual Growth Rate)
As you can see Qi Value continues to do well. Not the highest returns but very consistent high returns which gives it the highest total return and compound annual growth rate.
8.3 times better than the market
Qi Value’s total return of +1223.0% was the highest, and was 8.3 times that of the market and 210.3% better than Price to Book the second best performing strategy.
Not all strategies tested again
Just in case you were wondering - we are not selectively showing the results of other strategies so that Qi Value looks best we do not test all the strategies all the time as it is a lot of work.
How to start using Qi Value in your portfolio right now
Where can you find it?
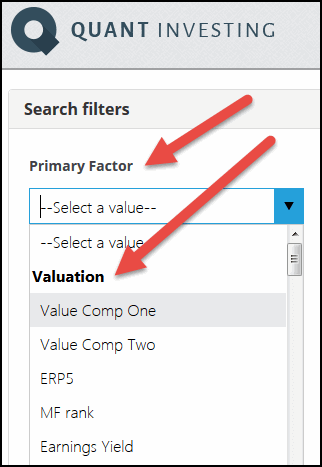
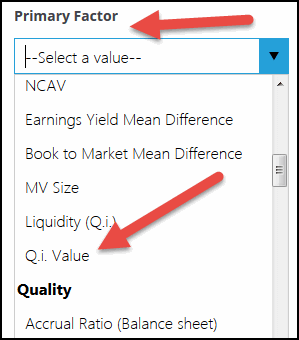
Q.i. Value, like all ratios and indicators in the screener, is very easy to find and use. You can select it in any one of the four factors (or filters) as shown below.
Qi Value is one of the last items under heading Valuation.
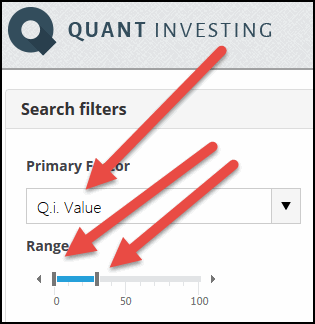
Get the most undervalued companies
To get the most undervalued companies set the slider from 0% to as far as you would like to go. The top 30% (0% to 30%) most undervalued companies are selected in the image below.
Combine Qi Value with your investment strategy
Once you have selected the best Qi Value companies you can add your favourite ratios or indicators – here are a few suggestions:
Momentum
Combine Qi Value with the following indicators to find companies with an upward moving share price – this is a good way to avoid value trap companies.
The following are all good indicators to use:
- Price Index 6 months
- Price Index 12 months - 1 month
- Price Index 12 months
- Adjusted Slope 125/250d
- Adjusted Slope 90d
You can find the exact definition of all ratios in the Glossary.
You can read more about why and how momentum works here:
10 myths about momentum investing, squashed
How to find stocks on the move with a better momentum indicator - exponential regression
Piotroski F-Score
The Piotroski F-Score is a great indicator you can use to select good quality companies – I use it all the time with the screens I use.
You can read more about the Piotroski F-Score here:
Can the Piotroski F-Score also improve your investment strategy?
Use the Piotroski F-Score to seriously improve your returns
This academic can help you make better investment decisions – Piotroski F-Score
Market leaders (large companies on steroids)
If you prefer investing in large companies Market Leaders is a great universe to look for investment ideas.
The name Market Leaders come from the book What Works On Wall Street where James O'Shaughnessy tested an investment strategy of only investing in market leading companies which resulted in market beating performance.
James defined Market Leaders as Non-utility companies with larger than average:
- Market value
- Number of shares outstanding
- Free Cash flow and
- Sales above 1.5 times the average of the universe
You can read more about market leading companies are and where to find it in the screener here: Large companies on steroids – Market Leaders
The best valuation ratio you can use
From all the above research I am sure you will agree that Qi Value is a great indicator because it finds undervalued companies using a number of proven ratios combined into a single value.
Its results speak for themselves, higher returns with lower volatility, something I am sure you are also interested in.
PS To get access to Qi Value, for over 22,000 companies worldwide as well as more than 110 other ratios and indicators why not subscribe to the screener right now, it costs less than an inexpensive lunch for two, just click here: Sign me up right NOW!
PPS It’s so easy to put things off, why not sign up now and start improving your returns.